Characterization of gene expression and genetic variation of horse ERBB receptor feedback inhibitor 1 in Thoroughbreds
Article information

Abstract
Objective
This study aimed to test the expression patterns of ERBB receptor feedback inhibitor 1 (ERRFI1) before and after exercise and the association of non-synonymous single-nucleotide polymorphisms (nsSNPs) of horse ERRFI1 with racing traits in Thoroughbreds.
Methods
We performed bioinformatics and gene expression analyses for horse ERRFI1. Transcription factor (TF) binding sites in the 5′-regulatory region of this gene were identified through a tool for prediction of TF-binding site (PROMO). A general linear model was used to detect the association between the nsSNP (LOC42830758 A to G) and race performance.
Results
Quantitative polymerase chain reaction analysis showed that expression level of ERRFI1 after exercise was 1.6 times higher than that before exercise. Ten transcription factors were predicted from the ERRFI1 regulatory region. A novel nsSNP (LOC42830758 A to G) was found in ERRFI1, which was associated with three racing traits including average prize money, average racing index, and 3-year-old starts percentile ranking.
Conclusion
Our analysis will be helpful as a basis for studying genes and SNPs that affect race performance in racehorses.
INTRODUCTION
The horse industry, which includes breeding, racing, and riding, comprises a large proportion of the tourism and leisure industry [1]. In this industry, the athletic performance of a racehorse is the most important factor. Thus, biological characters—such as genetic variation, gene expression, and metabolic patterns—that relate to athletic performance have been studied in regard to molecular breeding and biomarker screening [2–5]. Skeletal muscle in racehorses is directly responsible for athletic performance with numerous genes involved in the process [6]. Furthermore, the Thoroughbred is a widely used animal model in exercise physiology [7] because it has high proportion of skeletal muscle mass comprising over 55% of its total body mass [8]. However, due to a lack of data and phenotypes as well as to the complex genetic architecture usually underlying quantitative traits, research on the biological characteristics of Thoroughbreds remains a challenge [9].
Genetic association studies have found suitable DNA markers for race traits in horses using single-nucleotide polymorphisms (SNPs). Most research has focused on athletic performance traits, locomotion, i.e., gaits; racing performance; and energy production [10]. A variant of doublesex and mab-3 related transcription factor 3 is significantly associated with the ability to pace in Icelandic horses, and it appears to be necessary for horses in other breeds to perform alternate gaits [2]. In addition, two performance-associated sequence variants of exercise-related genes, e.g., myostatin (MSTN) and pyruvate dehydrogenase kinase 4 (PDK4) have been studied. Two SNPs, MSTN (g.66493737C/T) and PDK4 (g.38973231 A/G), have been identified in relation to race performance, and MSTN (g.66493737C/T) has previously been shown to contribute to muscle hypertrophy in a range of mammalian species and racing ability in horses while PDK4 (g.38973231 A/G) has been shown to contribute to weight advantage in terms of handicap rating [3,4,11]. Glucose utilization regulation is tightly controlled by the uptake of glucose by glucose transporters, the rate of glycolytic flux, and the conversion of pyruvate to acetyl-CoA in mitochondria via the catalytic function of the pyruvate dehydrogenase complex (PDC). The critical rate-limiting step in the oxidation of glucose is the regulation of the PDC assemblage, which is controlled by pyruvate dehydrogenase kinase (PDK). PDK blocks the formation of the PDC resulting in beta-oxidation of fatty acids to acetyl-CoA, which is the substrate for oxidative phosphorylation. The oxidation of fatty acids is highly efficient in generating ATP and is controlled by PDK4 expression in skeletal muscle during and after exercise [12].
In a previous study, we conducted RNA-sequencing of skeletal muscle genes from six Thoroughbred horses before and after exercise in which several differentially expressed genes (DEGs), i.e., Peroxisome proliferator activated receptor delta, adrenoceptor beta 2, and glutamate-cysteine ligase catalytic subunit (GCLC)/glutamate-cysteine ligase modifier subunit (GCLM), were identified and characterized further to reveal the gene expression pattern associated with leukocytes in various horse tissues and for exercise times [13–16]. In addition, we identified cell development-associated genes such as ERRFI1, which is induced by exercise, but these remain to be characterized.
ERRFI1, which is related to induction during the mid-G1 phase of the cell cycle, is considered an immediate early response gene that can be induced by a variety of external stimuli including growth factors, cytokines, and stress factors [17,18]. Disruption of murine ERRFI1 leads to excessive osteophyte formation due to the hyperproliferation and chondrocytic differentiation of mesenchymal progenitor cells. This causes a form of premature joint degeneration that closely resembles osteoarthritis [19]. There are no data explaining the correlation between ERRFI1 genetic variation and exercise.
In this study, we focused on the race performance-related characterization of ERRFI1 in Thoroughbreds. The expression of ERRFI1 was confirmed in muscles and leukocytes before and after exercise, and subsequently, the transcription factor (TF)-binding sites within the regulatory region of ERRFI1 were predicted. In addition, we found a novel non-synonymous SNP (nsSNP) in this gene and analyzed the correlation between it and race performance traits. Taken together, our results may contribute to the development of a genetic marker for the evaluation of race performance and selective breeding.
MATERIALS AND METHODS
Experimental animals and phenotypes
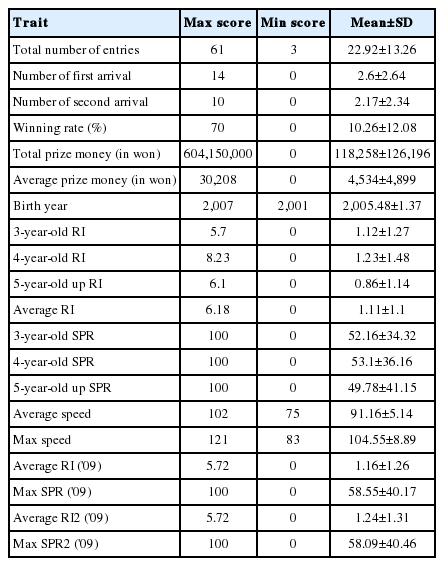
Racehorse information and race records were compiled in 2009 from the Korea Racing Authority (KRA) homepage (http://studbook.kra.co.kr/studbook.jsp). The racehorses used in the analysis were born between 2001 and 2007 with 16 horses born in 2007, 52 horses born in 2006, 13 horses born in 2005, 6 horses born in 2004, 7 horses born in 2003, 3 horses born in 2002, and 2 horses born in 2001. Horses used for this study comprised 44 females, 32 gelding, and 23 males. The average racing index (RI) and highest starts percentile ranking (SPR) were recorded for each age. RI was obtained by comparing the average prize money obtained per race by a particular horse with that paid on average to other horses racing at that location with the same birthplace and age. An RI of 1 indicates that the horse obtained the average prize money; an RI of 2 indicates the horse obtained twice the average prize money; and an RI of 0.5 indicates the horse obtained half the average prize money. SPR is a method of comparing racehorses based on the horse’s class performance index (CPI) value and is expressed as a percentile with 100 being the highest and 0 the lowest. Thus, an SPR of 100 indicates the highest grade racehorse and an SPR of 0 indicates the lowest grade racehorse. CPI is an index calculated by comparing the total prize money of a given racehorse obtained for 1 year to the average prize money obtained by all racehorses for 1 year with a CPI of 1 being average. Speed Index was the average score of winners in the last three years by distance. Index was set at 100 and it is adjustment by 1 every 0.2 seconds. The higher index was mean better traits (Table 1).
Sample preparation
Blood samples were collected from 99 domestic thoroughbred racehorses that had run a race at the Seoul Lets Run Park. To extract genomic DNA, 900 μL red blood cell (RBC) lysis solution was added to 300 μL of blood, processed for 3 minutes, and centrifuged at 15,000 rpm for 30 seconds. The supernatant was removed, and 300 μL of cell lysis solution and 100 μL of protein precipitation solution were added, and the solution was processed and mixed thoroughly. The DNA solution layer was collected by centrifuging the solution at 15,000 rpm for 5 minutes, and the supernatant was added to 300 μL isopropanol and shaken slowly. The resulting solution was centrifuged at 15,000 rpm for 10 minutes, and the supernatant was removed. And 500 μL of ethanol was added to the supernatant, and the solution was shaken until it became clear and then centrifuged at 15,000 rpm for 3 minutes. DNA was extracted by volatilizing and removing ethanol.
RNA extraction and cDNA synthesis
Horse skeletal muscle tissue (50 to 100 g) was crushed with a mortar, and 3 mL whole blood was mixed with 9 mL RBC lysis buffer (Solgent, Daejeon, Korea) to remove RBC, where were dissolved using 1 mL Trizol (Invitrogen, Karlsruhe, Germany). Next, 200 μL chloroform was added to remove cells from organic solvent, and the mixture was shaken for 10 seconds and left at 4°C for 5 minutes and then centrifuged at 4°C for 15 minutes. The supernatant was removed and added to a new test tube, mixed with the same amount of isopropanol, and left at 4°C for 15 minutes to collect RNA pellets. Isopropanol was removed by centrifuging the solution at 4°C for 15 minutes, and it was sterilized with 85% ethanol and dissolved in RNase-Free Water. The purity of the extracted RNA was confirmed by measuring absorbance at 230 nm and 260 nm using a spectrophotometer (ND-100, Nanodrop Technologies Inc., Wilmington, DE, USA), and only RNA with a purity (optical density value of 230 nm/260 nm) greater than 1.8 was selected and stored at −70°C until the experiment was carried out.
To synthesize cDNA, 2 μg of RNA and 1 μL each of oligo-dT (Invitrogen, Waltham, MA, USA) and RNase-Free Water were added. The RNA was denatured at 80°C for 3 minutes, and cDNA was synthesized using 4 μL of 5× reverse transcription (RT) buffer, 5 μL of 2 mM dNTPs, 0.5 μL of RNase inhibitor (Promega, Madison, WI, USA), and 1 μL of Moloney-murine leukemia virus (M-MLV) reverse transcriptase (Promega, USA).
Polymerase chain reaction analysis
NCBI (http://www.ncbi.nlm.nih.gov) and Ensembl Genome Browser (www.ensembl.org) were utilized to retrieve gene sequence information. The primers used to detect SNPs were synthesized using PRIMER3 software (http://bioinfo.ut.ee/primer3-0.4.0/), and the synthesized primers included ERRFI1 primers F (5′-AAGCTGTAGCAGCCCAGGTA-3′) and ERRFI1 primers R (5′-TCCCAAGCTTTCACTTGAGG-3′). To determine the genotype of ERRFI1 SNPs, polymerase chain reaction (PCR) was conducted on the genomic DNA of racehorses using the following conditions: initial denaturation at 94°C for 10 minutes; 40 cycles of denaturation at 94°C for 30 seconds, annealing at 58°C for 30 seconds, and extension at 72°C for 30 seconds; and final extension at 72°C for 10 minutes. PCR products were separated in a 1.5% SeaKem LE agarose gel (Lonza, Rockland, MA, USA), detected under UV light, and subjected to Sanger sequencing for confirmation after cloning. Cloning of PCR products was carried out using a pGEM-T Easy Cloning Vector System (Promega, USA), and each gene sequence was confirmed through Sanger sequencing. SNPs were checked by comparing the gene sequence obtained from sequencing with those obtained from a BLAST search (National Center for Biotechnology Information, Bethesda, MD, USA).
Real time-quantitative polymerase chain reaction amplification
The synthesized primers for quantitative PCR (qPCR) included ERRFI1 primers F (5′-TGACCCAATAACCATGGCCT-3′) and R (5′-ATAATCAGAGGGGGCAAGCTG-3′). Real-time qPCR was carried out using a C1000 Thermal Cycler (Bio Rad, Hercules, CA, USA) to measure the relevant expression of target genes; 25 μL of reaction solution was used and the solution was constructed as follows: 2 μL diluted cDNA (50 ng/μL) was added to 14 μL SYBR green master mix (Bio Rad, USA), 1 μL each of 5 pmol/μL diluted forward and reverse primers. The conditions used for the real-time qPCR were as follows: initial denaturation at 94°C for 10 minutes followed by 40 cycles of denaturation at 94°C for 10 seconds, annealing at 60°C for 10 seconds, and extension at 72°C for 30 seconds. All measurements were carried out in triplicate for each specimen, and the 2−ΔΔCt method was used to determine relative gene expression [20]. The relative expression of target genes was normalized with glyceraldehyde-3-phosphate dehydrogenase (GAPDH) [13].
Transcription factor binding site prediction
Transcription factor binding sites were predicted using the ALGGEN PROMO software program v8.3 (http://alggen.lsi.upc.es).
Statistical analysis
Allele frequencies for each genotype were derived from the observed distribution of the controls and were used to calculate expected genotype percentages. Observed genotype frequencies for the controls were compared to expected frequencies to test for Hardy-Weinberg equilibrium using a x2 test. Genotype and allele frequencies were determined by direct counting. A generalized linear model (GLM) was used to estimate the association of ERRFI1 SNPs with race performance traits. The GLM was performed using SAS (version 9.3) with the three genotypes as independent variables and the racing traits as the dependent variable.
RESULTS AND DISCUSSION
Expression of ERRFI1 and ERRFI1-associated genes in horse
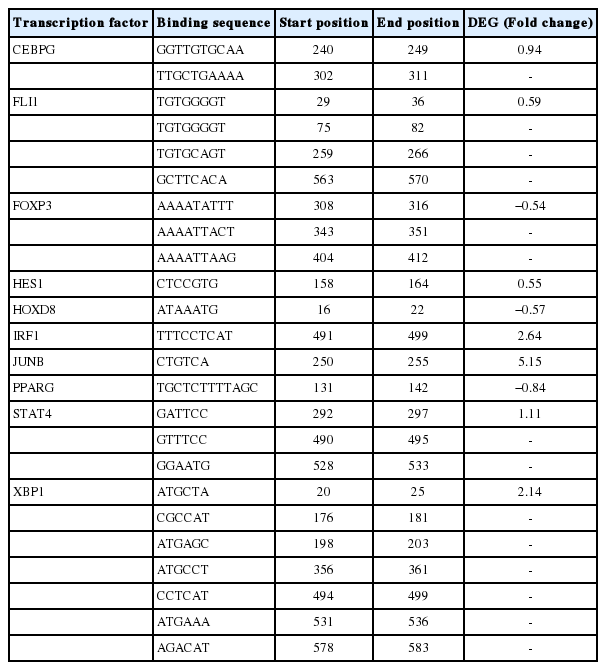
In our previous studies, we identified ERRFI1 as a DEG in response to exercise and a selection signature gene related to the athletic adaptation of Thoroughbred muscle [14,16]. In this study, we found a 1.6-fold increase of ERRFI1 transcript after exercise compared to before exercise by qPCR (Figure 1). To explain this expression pattern, 177 TF binding sites were predicted in the region defined by the ERRFI1 gene to 600 bp upstream using PROMO (data not shown). When the predicted TF genes were matched to the DEGs, we found that the genes CCAAT/enhancer binding protein gamma, fli-1 proto-oncogene, ETS transcription factor (FLI1), hes family bHLH transcription factor 1 (HES1), interferon regulatory factor 1 (IRF1), junB proto-oncogene (JUNB), signal transducer and activator of transcription 4, and X-box binding protein 1 were upregulated, and forkhead box protein P3 (FOXP3), homeobox D8 (HOXD8), and peroxisome proliferator activated receptor gamma (PPARG) were downregulated (Figure 2, Table 2).

Gene expression of ERRFI1 in the muscle of Thoroughbred horses before and after exercise using qPCR. *** p<0.001. ERRFI1, ERBB receptor feedback inhibitor 1.

Transcription factor (TF)-binding site prediction in the region from the ERRFI1 gene to 600 bp upstream. Elements on the upper side indicate binding sites of the upregulated transcription factors and those on the lower side indicate binding sites of the downregulated transcription factors in Thoroughbred horses after exercise. ERRFI1, ERBB receptor feedback inhibitor 1.
Exercise stress causes inflammation due to immune responses, which are associated with the activation of pro-inflam-matory and anti-inflammatory pathways [14,21]. Muscle injury caused by exercise is a well-known phenomenon that causes an inflammatory response [22,23]. Cytokines comprise a variety of intercellular signaling proteins that affect target cells. Cytokines are signaling proteins that affect target cells that are related to cell migration, proliferation. Exercise-induced skeletal muscle damage causes acute inflammatory responses and activates the muscle fiber regeneration processes, and various cytokines can regulate in vivo muscle inflammation and muscle fiber regeneration [22].
The FOXP3 inhibits T helper cells’ ability to function by directly inhibiting the activity of nuclear factor of activated T-cells and nuclear factor kappa-light-chain-enhancer of activated B cells which are important for cytokine gene expression and T cell function [24]. The pattern recognition receptor (PRR) recognizes pathogen-associated molecular patterns that cause inborn immune responses. The IRF1 is involved in most PRR signaling events, given its immune activation capabilities that link innate and adaptive immunity [25,26]. The JUNB is an immediate-early gene that regulates expression through a variety of extracellular stimuli. In addition, it plays a crucial role in cellular responses to given stimuli. The FLI1 gene is an important regulator that modulates the expression of a variety of important cytokines. When FLI1 expression inhibits endothelial cells, it reduces interleukin 6 (IL-6) production [27,28], which is induced in muscle in response to exercise-induced stress in horses [14,16]. IL-6 is not activated in resting muscles, but it is rapidly activated by muscle contraction and released from the muscles during exercise. The JUNB promoter is activated by the IL-6 response element [29,30]. Finally, ERRFI1 has been reported to be an important factor in the regulation of the stress response, maintenance of tissue homeostasis (such as in joints or heart muscle), and as a tumor suppressor [31]. Thus, we conclude that ERRFI1 may be an important regulator of inflammatory responses caused by exercise.
Association analysis between candidate gene polymorphisms and racing traits of Thoroughbred horses
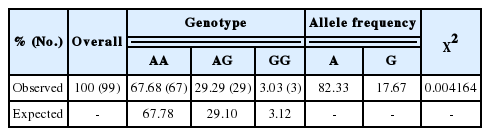
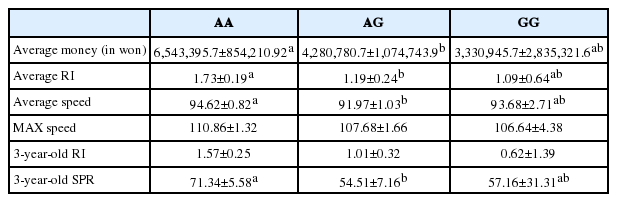
To evaluate horse ERRFI1 as a genetic marker associated with racing traits, nsSNPs were screened from the coding regions of ERRFI1 in the horse genome. As a result, an nsSNP was found in the 3rd exon (42830758th sequence of chromosome 2) where base changes from A to G caused an amino acid change from asparagine to aspartic acid at the 83rd amino acid (Figures 3A, 3B). When DNA genotyping of the 99 Thoroughbreds was individually performed, 67 horses possessed the AA genotype, 29 the AG, and 3 the GG, and the allele frequencies were 81.5% and 17.5% for A and G, respectively. A Hardy-Weinberg equilibrium analysis was performed to compare genotyped (observed) to expected allele frequencies. An assumption of this method is that the alleles within each group are statistically independent, at least when no association exists, which is equivalent to assuming that the genotype frequencies in the general population comply with Hardy-Weinberg Equilibrium proportions. The result of the x2 test indicated a significant (<0.01) difference between the expected and observed genotype frequencies meaning that the frequencies of all genotypes were in Hardy-Weinberg equilibrium (Table 3). The correlation between racing traits and ERRFI1 genotypes was tested by GLM analysis, and we found that genotypes were significantly correlated with average prize money, average RI, Average speed and 3-year-old SPR. Horses with the AA genotype possessed high-scoring racing traits while individuals with the GG genotype had low-scoring racing traits. Individuals with the AG genotype had median racing trait values. Similarly, higher max speed, and 3-year-old RI were associated more closely with the AA genotype compared to others even if they were not significantly different (Table 4).

(A) Structure and position of an nsSNP (LOC42830758 A to G) in the ERRFI1 gene. Filled boxes depict ERRFI1 coding regions. (B) Analysis of the novel nsSNP within ERRFI1 gene. AA genotypes show red graph, GG genotypes show yellow graph and AG genotypes show both red and yellow graph. ERRFI1, ERBB receptor feedback inhibitor 1.
Chi-squared and Hardy-Weinberg equilibrium testing of SNP-type distributions for SNPs (LOC42830758 A to G) of the ERRFI1 gene
In conclusion, we proposed that the induction of ERRFI1 and the regulation of inflammatory responses due to muscle damage in horses were correlated, and we subsequently found novel nsSNPs of horse ERRFI1. Further, we demonstrated the relationship between genotypes and racing traits, and the results from this study may contribute to the development of a genetic marker for the evaluation of racing performance and selective breeding.
ACKNOWLEDGMENTS
This study was supported by grants from the Next Generation BioGreen 21 Program (No. PJ01117301, PJ01104401), Rural Development Administration, Republic of Korea.
Notes
CONFLICT OF INTEREST
We certify that there is no conflict of interest with any financial organization regarding the material discussed in the manuscript.