Comparison among methods of effective energy evaluation of corn silage for beef cattle
Article information

Abstract
Objective
This study was conducted to compare different methods on effective energy evaluation of corn silage for beef cattle.
Methods
Twenty Wandong bulls (Chinese indigenous yellow cattle) with initial body weight of 281±15.6 kg, were assigned to 1 of 5 dietary treatments with 4 animals per treatment in a randomized complete block design. Five dietary treatments included group 1 with corn silage only diet, group 2 with corn silage-concentrate basal diet (BD) and 3 groups with 3 test diets, which were the BD partly substituted by corn silage at 10%, 30%, and 60%. The total collection digestion trial was conducted for 5 d for each block after a 10-d adaptation period, and then an open-circuit respiratory cage was used to measure the gas exchange of each animal in a consecutive 4-d period.
Results
The direct method-derived metabolizable energy and net energy of corn silage were 8.86 and 5.15 MJ/kg dry matter (DM), expressed as net energy requirement for maintenance and gain were 5.28 and 2.90 MJ/kg DM, respectively; the corresponding regression method-derived estimates were 8.96, 5.34, 5.37, and 2.98 MJ/kg DM, respectively. The direct method-derived estimates were not different (p>0.05) from those obtained using the regression method. Using substitution method, the nutrient apparent digestibility and effective energy values of corn silage varied with the increased corn silage substitution ratio (p<0.05). In addition, the corn silage estimates at the substitution ratio of 30% were similar to those estimated by direct and regression methods.
Conclusion
In determining the energy value of corn silage using substitution method, there was a discrepancy between different substitution ratios, and the substitution ratio of 30% was more appropriate than 10% or 60% in the current study. The regression method based on multiple point substitution was more appropriate than single point substitution on energy evaluation of feedstuffs for beef cattle.
INTRODUCTION
Forage is generally the principle ingredient in feedlot diets for growing cattle, and can constitute up to 60% of the diet’s dry matter (DM) [1]. Corn (Zea mays L.) silage is a major forage source for ruminants around the world. Energy is crucial to dietary provision for animal production, and determining the energy available to beef cattle is partly dependent on knowledge of the metabolizable energy (ME) and net energy (NE) contents of feedstuffs formulated into diets. Therefore, a need exists to better understand the ME and NE values of corn silage.
For the energy evaluation of feedstuffs for ruminants, mathematical models of energy utilization are based on chemical composition of feedstuffs and influenced by the methodology followed by in vitro [2] or in situ [3,4] techniques to determine energy utilization are generally used around the world. However, the limitation of these conventional models is that neither in vitro nor in situ methods reflect the true metabolic physiology of animals as reported by Birkett and de Lange [5]. Thus, an in vivo technique containing direct method and indirect method is always preferred and commonly used for non-ruminant species [6–8]. More recently, this approach has been applied to ruminants in China [9,10]. The published study has summarized methods of energy evaluation of feed ingredients and their accuracy [11], and also compared the nutritional evaluation of dietary ingredients rabbits among methods in a collaborative study carried out in four laboratories [12]. However, there is a dearth of methodological studies on feedstuffs evaluation for beef cattle. Therefore, this study, involving a corn silage only diet for direct method and different ratios of corn silage substitution into basal diet (BD) for substitution and regression methods, aimed to compare different methods on ME and NE evaluation of corn silage for beef cattle.
MATERIALS AND METHODS
The study was conducted from mid-November to mid-December in 2016 at a beef cattle farm in Fengyang county, Anhui province, China. The animals were treated as approved by the Humane Animal Care and Ethics Committee of the Nanjing Agricultural University, China (SYXK2011-0036).
Animals, experiment design, and diets
Twenty Wandong bulls (Chinese indigenous yellow cattle; 281±15.6 kg) were allocated to five groups in a randomized complete block design according to the initial body weight (BW), and each group was assigned to 1 of 5 dietary treatments. The 5 dietary treatments included group 1 fed only a corn silage diet for the direct method of energy evaluation, group 2 with corn silage-concentrate BD and 3 groups with 3 test diets (TD) for substitution and regression methods. In the 3 TD, the energy-yielding ingredient from BD was partly replaced by corn silage at 3 substitution ratios (10%, 30%, and 60%). Animals were housed in individual stalls, and fed twice daily (08:00 and 16:00 h) with free access to water. The ingredient composition and nutrient content of experimental diets are presented in Table 1. The experimental period was 19 d, with the first 10-d as an adaptation period and the last 9-d as the test period. Total collection of feces and urine for each bull was carried out for consecutive 5-d from day 11 to 15. Then, gas exchange measurement was conducted for consecutive 4-d (day 16 to 19) followed by the digestion trial. For gas exchange trial, the heat production (HP) and methane emission of each bull was measured using an open-circuit respiratory head cage (details as follows). The measurement process was repeated for 4 times daily for each bull with the following schedule: 06:00 h (represented pre-feeding 1 h), 12:00 h (represented diurnal rest), 18:00 h (represented post-feeding 1 h), and 24:00 h (represented nocturnal rest), each 8 to 12 min in duration. The all-day HP and methane emission of each bull were given as the mean values extrapolated from the 4 repeated measurements daily.

Ingredients and nutrient content of the experimental diets for bulls
Open-circuit respiratory head cage
The structure of the open-circuit respiratory cage was similar to that described by Suzuki [13]. The system was mainly comprised of a head cage, flow meter, gas analyzer, blower and air filter and dryer. The head cage with total capacity of 895 L (80× 80×140 cm3) was made of wood structure and rigid transparent plastic. The head cage was equipped with an axial fan on the ceiling of the cage to mix the air, and two copper-constantan thermocouples on the sides to measure the dry and wet bulb temperature. The oxygen concentration of inlet and outlet air from the head cage was measured with a paramagnetic analyzer (8000M, resolution 0.01%; Signal Instrument, Camberley, UK), and methane concentration was measured with a photoacoustic multigas monitor (INNOVA 1412; LumaSense Technologies, Ballerup, Denmark). Measurements of oxygen concentration (%), methane concentration (mg/m3), dry-wet bulb temperature of the room and chamber were collected in 1-min periods by a digital logger (TR2723; Advantest Corporation, Tokyo, Japan). The ventilation rate was approximately 400 L/min, and was measured by a flow meter (Model FWH-N-S; Nippon Flow Cell Co. Ltd., Tokyo, Japan). The air flow rate was read every minute, and was almost constant. The calorimetric system was calibrated using the pure nitrogen (99.99%) injection method of releasing a pre-weighed quantity of nitrogen gas into the system [14]. The HP was calculated according to McLean and Tobin [15]: HP = 20.47× ΔFO2×V×STPf×Nf×60/BW0.75, where HP = the rate of HP (kJ/kg0.75 per h); 20.47 = the coefficient of energy expenditure of per oxygen consumption (kJ/L); ΔFO2 = the difference in the percentages of oxygen concentration between the inlet and outlet air of the head cage (%); V = the air flow rate of the respiratory head cage (L/min); STPf = the standard temperature and barometric pressure factor; Nf = the nitrogen calibration factor; BW0.75 = metabolic body weight (kg). The methane emission was considered as the difference in methane concentration between the inlet and outlet air of the head cage multiplied by the ventilation volume.
Sampling, measurements, and analyses
The representative samples of feeds were collected weekly, and were dried to a constant weight in a forced-air oven at 60°C to 65°C. Total collection of feces was carried out daily during the 5-d period. Feces were weighed daily and individually homogenized, and then a 10% sample of the total weight of feces was also dried in a forced-air oven at 60°C to 65°C. All feed and fecal samples were ground to pass a 0.5-mm screen using a mill grinder (Retsch ZM 100; Retsch GmbH and Co. K.C., Haan, Germany), and then were stored at 4°C until analysis. Total urine was collected daily during the 5d collection period using a rubber funnel, which was fitted tightly over the animal’s penis. Urine was collected in a bucket containing 100 mL of 10% H2SO4 to maintain a pH below 3. The total volume was measured, and a sample (10 mL/L of total volume) was stored at −20°C for subsequent analysis.
The DM (method 934.01), ash (method 967.05), crude protein (CP; method 984.13), ether extract (EE; method 920.39), Ca (method 968.08), and P (method 985.01) of dried samples (feeds and feces) were analyzed according to AOAC [16]. The neutral detergent fiber (NDF) and acid detergent fiber (ADF) were determined by an Ankom 200 Fiber Analyzer (F57 Filter Bags; Ankom Technology, NY, USA) following the procedures of Goering and Van Soest [17] and Goering and Van Soest et al [18]. The gross energy (GE) was determined using a bomb calorimeter (C200; IKA Works Inc., Staufen, Germany). For urine samples, total nitrogen (N) and GE were determined as described above. Before combustion for GE measurements, a 10mL sample of urine was absorbed by two pieces of quantitative filter paper of known weight (Wohua filter paper Co. Ltd., Hangzhou, China) and ovendried at 60°C. The caloric concentration of the quantitative filter paper was also determined, and the urinary GE calculated as the difference in GE value of between the quantitative filter paper with urine and the quantitative filter paper.
Data calculations
The DE and ME were calculated as follows:
The CH4-E was calculated as the methane emission (L/d) multiplied by the caloric value of methane (39.54 kJ/L). The fasting heat production (FHP) was estimated as the antilog of the intercept confidence interval (95%) of the linear regression between the log of HP and ME intake [19], and the retained energy (RE) was calculated by deducting the loss of HP from the ME. Consequently, NE was expressed as the sum of FHP and RE.
The nutrient apparent digestibility and effective energy value of test ingredients were calculated as previously described by Adeola [20]:
Where ID, TDD and BDD are the nutrient apparent digestibility of ingredient, TD and BD, respectively (%); IE, TDE, and BDE are the energy value of ingredient, TD and BD, respectively (MJ/kg DM); X is the substitution ratio of ingredient. Alternatively, the effective energy in test ingredient can also be estimated by the regression of energy contribution of test ingredient correcting the substitution ratio to the total dietary energy (test ingredient-associated energy intake) against the test ingredient DM intake as described by Adeola and Ileleji [21]. The test ingredient-associated energy intake was calculated as:
Where TDintake and BDintake are the TD energy intake (MJ/d DM) and BD energy intake (MJ/d DM). The net energy requirement for maintenance (NEm) and gain (NEg) of feedstuff was calculated as the following formulas described by NRC [22]:
Where ME is ME concentration in feedstuff (Mcal/kg DM).
Statistical analyses
Data were analyzed as a randomized complete block design using IBM SPSS Statistics software (Ver. 20.0 for Windows, SPSS Inc., Chicago, IL, USA). Results were presented as means and standard error of the mean. Comparisons of means were performed by Duncan’s comparison test of one-way analysis of variance, and the level of significance was evaluated at p< 0.05. Linear regressions were conducted with a general linear model procedure in SPSS. Test ingredient-associated DE, ME, or NE intake (MJ) was regressed against the test ingredient intake (kg, DM basis) for each block, and slopes generated from regressions were equal to the DE, ME, and NE concentrations in megajoule per kilogram DM of test ingredient. The slope data from 4 blocks also were analyzed as a one-way analysis of variance in a completely randomized design.
RESULTS
The chemical composition of corn silage
The analyzed chemical composition of corn silage used in this study is presented in Table 2.

Chemical compositions of corn silage used in this study
Nutrients digestibility and energy balance of diets for bulls determined by direct and substitution methods
Results from the dietary nutrient digestibility for bulls determined by direct and substitution methods are shown in Table 3. Obviously, the apparent digestibility of DM, organic matter (OM), CP, NDF, and ADF decreased linearly (p<0.05) with the increased corn silage substitution ratio. The lowest nutrients apparent digestibility occurred in the corn silage only diet group compared to other groups.

Dietary nutrient apparent digestibility for bulls determined by direct and substitution methods
Results from the dietary energy intake, energy outputs and efficiency of utilization for bulls determined by direct and substitution methods are shown in Table 4. As corn silage substitution into the BD increased from 0% to 60%, the intake of GE, DE, ME, and NE decreased linearly (p<0.05). The corn silage only diet group obtained the lowest value compared with other corn silage substitution diet groups. The daily output of UE and CH4-E were not affected (p>0.05) by corn silage substitution but there was a linearly increase (p<0.05) in the daily FE output. In addition, the energy digestibility (DE/GE) and metabolizability (ME/GE) also decreased significantly (p<0.05) with the increasing of corn silage substitution.

Dietary energy utilization efficiency for bulls determined by direct and substitution methods
Comparison of nutrients digestibility and energy values of corn silage following different methods
As shown in Table 5, the apparent digestibility of NDF and ADF of corn silage were similar (p>0.05) among groups, whereas the DM, OM, and CP apparent digestibility of corn silage determined by direct method (corn silage only diet group) were greater than those obtained in 60% group (p<0.05) but no significant difference compared with 10% group and 30% group (p>0.05). In addition, the energy efficiency of digestibility and metabolizability of corn silage in the corn silage only diet group were lower than that in 10% group (p<0.05) but similar to those obtained in 30% group and 60% group (p>0.05).
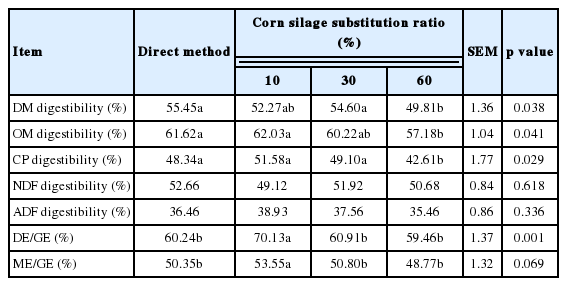
Nutrient apparent digestibility of corn silage for bulls determined by direct and substitution methods
The effective energy values of corn silage can be estimated by direct and substitution methods. Alternatively, the energy values of corn silage can also be estimated by extrapolation using multiple point substitution. Strong regressions were found between the energy intake associated with corn silage substituted portion in the BD and the DM intake of substituted corn silage (Figure 1). Regression equations for DE, ME, and NE were Y = 10.80X+0.34 (R2 = 0.98, p<0.001), Y = 8.98X+ 0.31 (R2 = 0.97, p<0.001) and Y = 5.60X+0.19 (R2 = 0.99, p<0.001), which generated the DE, ME, and NE values of 10.80, 8.98, and 5.60 MJ/kg DM for corn silage.

Regression of digestible energy (DE), metabolizable energy (ME), or net energy (NE) intake (Y, MJ) associated with the test ingredient (corn silage) against the dry matter (DM) intake of test ingredient (X, kg). Regression equations were Y = 10.80X+0.34, n = 16, R2 = 0.98, p<0.001 for DE, Y = 8.98X+0.37, n = 16, R2 = 0.97, p<0.001 for ME and Y = 5.60X+0.19, n = 16, R2 = 0.99, p<0.001 for NE, respectively.
Comparative direct method-, substitution method- and regression method-derived DE, ME, NE, NEm, and NEg values of corn silage are presented in Table 6. Obviously, direct method-derived estimates were not different from regression method-derived estimates (p>0.05). There was significantly discrepancy (p<0.05) in the energy estimates of corn silage calculated by different substitution ratios when using single substitution method. In addition, the energy estimates of corn silage derived at the substitution ratio of 30% were more similar to direct method- and regression method-derived estimates (p>0.05).

Comparison on effective energy evaluation of corn silage for bulls by different methods
DISCUSSION
Dietary nutrient digestibility and energy value
Nutrient apparent digestibility has served as the base for evaluating the utilization efficiency of individual feedstuff and diet for animals. The variability of nutrient digestibility was primarily attributed to the composition of diet. Traditionally, concentrate was usually more digestible than forage, resulting in that total diet digestibility generally depended on concentrate to forage ratio in the mixed diet [23]. In our study, the proportion of forage in the experimental diet increased linearly with the increasing of corn silage substitution into the BD, therefore, the nutrient digestibility decreased successively. Similar results were reported by Huhtaneii and Jaakkola [24] for cattle offered complete diets with different forage proportions on a DM basis. In addition, it has been well demonstrated that the crude fiber or NDF content showed a high negative correlation with nutrient digestibility [25,26]. The NDF content in diet increased gradually as corn silage substitution into the BD increased from 0% to 60%, and the highest NDF content occurred in the corn silage only diet in the current study. Consequently, in response to dietary NDF content, the nutrient digestibility decreased correspondingly. The energy utilization efficiency of diet was also affected by the composition of diet, including the digestible protein content and indigestible fiber content. The current study demonstrated that dietary effective energy was positively correlated to CP content but negatively correlated to NDF content, which was similar to the result as reported by Mc Geough et al [27].
Nutritional evaluation of corn silage for beef cattle by different methods
The nutritional value of feedstuffs for animals can be determined directly with a diet formulated with sole test ingredient such that all of the energy is supplied by the test ingredient (direct method) or indirectly with diets formulated with basal ingredient and test ingredient in given proportion such that energy supplied by other feed ingredients is proportionally substituted (substitution and regression method).
Direct method is commonly used for evaluating complete diets, but, for individual feedstuff, its use has been confined merely to some palatable forage whose chemical composition is relatively balanced [12]. The analyzed chemical compositions of corn silage in this study were 226.8 g/kg DM and 941.7 g OM, 74.3 g CP, 23.5 g EE, 661.7 g NDF, 376.3 g ADF, and 17.62 MJ GE per kilogram DM, being palatable for beef cattle. Furthermore, previous feeding study confirmed that cattle fed the corn silage only with premix diet had a positive performance in feed intake and growth, all of which indicated that corn silage can be evaluated using direct method for cattle. However, there is a situation where the feed ingredients have an unbalanced nutritional composition and are not suitable for direct method. Thus, substitution method is proposed to overcome the flaws in the direct method by feeding the test ingredient in conjunction with a suitable BD of known dietary energy value.
For the substitution method, the substitution ratio is directly related to the accuracy in the precision of estimation of feedstuff evaluation. Villamide [12] pointed out that the standard error of ingredient energy value estimated by substitution method is 13.4, 6.4, and 2.9 times higher than the SE of diets for 10%, 20%, and 40% substitution ratios, respectively. In the current study, a significant difference was observed in nutrients apparent digestibility (DM, OM, CP, DE/GE) and effective energy values of corn silage (DE, ME, NE) among three substitution ratios when using substitution method. This observation is consistent with the report of Zhao et al [28], who determined the energy value of Leymus chinensis for sheep by direct and substitution methods. Direct method-derived nutritional estimates of corn silage were different from those derived by substitution method in the 10% or 60% group. Nevertheless, direct method-derived estimates did not differ with the result obtained in 30% group in the current study. Maertens and De Groote [29] compared the substitution and direct method for evaluating alfalfa hay in rabbits and obtained similar results.
Given the variability of single point substitution, the regression method based on multiple point substitution is more reliable to evaluate the energy value of feedstuffs as reported by Villamide et al [13]. In this study, corn silage energy value was estimated by establishing the regression of energy intake associated with corn silage substituted portion and the DM intake of substituted corn silage. Recently, Adeola et al [7] determined the ME of corn distillers grains for broiler chickens by the foregoing regression of energy intake. In the same way, Bolarinwa and Adeola [8] determined the DE and ME of wheat for pigs. Regression and direct methods did not give different estimates of effective energy values of corn silage in our study, which was consistent with the report of Bolarinwa and Adeola [9]. In addition, the DE, ME, NE as well as NEm and NEg based on ME values estimated by regression method were close to substitution method-derived estimates at 30% of substitution ratio.
In summary, the effective energy values of corn silage for beef cattle evaluated by direct method were not different from those evaluated by regression method. In determining the energy value of corn silage using substitution method, the substitution ratio of 30% was more appropriate than 10% or 60% in the current study. Furthermore, the regression method based on multiple point substitution is more robust than single point substitution to estimate the energy value of corn silage.
Notes
CONFLICT OF INTEREST
We certify that there is no conflict of interest with any financial organization regarding the material discussed in the manuscript.
ACKNOWLEDGMENTS
This work was supported by the Public Welfare Industry (Agriculture) Scientific Research Projects (grant number 201303145), National Key R&D Plan (grant number 2016YFD0500508) and National Natural Science Foundation of China (31501930).